Portfolio planning
In this section of PWM we test the performance and volatility of two investment strategies using model portfolios. Each month we look at two baskets of shares – one global and one European.
GLOBAL PORTFOLIO
Looking at a sector from three different angles
Medical products are a global market sector leader. But which stocks to invest in depends on your style and preference. In this section, three different techniques are used. Only stocks with a minimum market cap of $1bn have been taken into consideration.
The “momentum” approach tries to locate 10 stocks that show the best price momentum. The optimisation is achieved by a risk return optimisation. The big advantage of this technique is the clear uptrend that the leading stocks show. Laggards or stocks in a clear downtrend can be avoided.
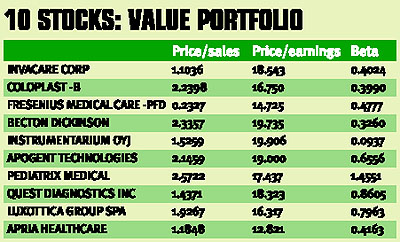
The pure “value” approach does not take into account trend or momentum with the idea that the valuation gap against the average of the sector will be filled sooner or later. This approach requires patience but can be very rewarding in the long term above all when the major indices are not in a very bullish environment that favours momentum.
It is interesting that just one stock appears in the momentum and in the value column: Becton Dickinson. This is an ideal combination.
The 10 leading stocks were selected for their optimal risk return relationship. Look at the clear up trend. (See Charts 1 and 2.)
Performance has its price (above). The valuation of the momentum portfolio is more than twice that of the value portfolio. The benchmarking portfolio is a good representative of the average valuation of the sector.
Chart 4: Medtronic carries a very high weight as it is an excellent representative of the sector.
EUROPEAN PORTFOLIO
The European sectors with the best long-term risk to reward ratio
Which market segments and sectors showed the best risk to reward ratio over the last three years?
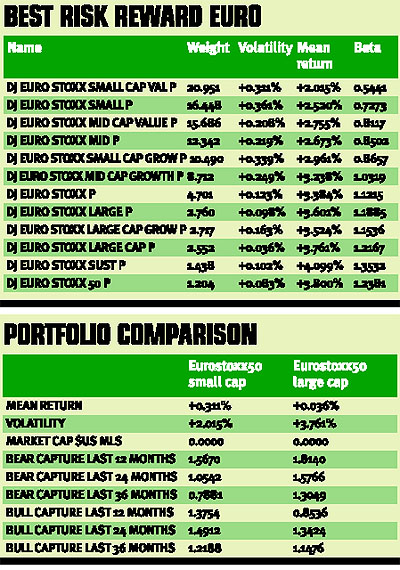
The small capitalisation value segment has won the highest allocation weighting when searching for high return and a low volatility exposure during different time periods over the last three years. This is a big change, as the highest cap stocks did much better than the small cap ones during the roaring bull market of the 1990s. The medium cap value segment is also leading, albeit at a less significant rate. These market segments might remain comparatively strong over the near future as they are favoured by the evolution of the economic cycle.
Which sectors do the investors favour? This depends on the sector indices that are used. The Pan European Stoxx 600 indicates the following ranking for the top five sectors: real estate, tobacco, transportation, mining and metals, medical products. The former two sectors are also strong on a global basis (Japan and North America), which enhances the validity of this research. Real estate is one of the top five sectors in the euro countries and shows the best risk to reward ratio of the last 36 months.
The pink line on Chart 1 (above) represents the EuroStoxx Small Cap Value segment which has achieved a profit of +2.13 % since June 2000. The EuroStoxx Large Cap segment lost –41.24% during the same time frame. The medium cap value segment is in the third position.
Chart 2: The five strongest sectors (real estate, tobacco, ind. transp.,
mining & met, medical prod.) over a mix of different time periods up to 36 months (blue) show a strong performance against the Stoxx600 (red).
The table above shows the interesting bear and bull capture ratios of
the two indices against the MSCI World $ Index. The leading small and medium cap value Indices have captured less of the market declines and more of the market rises over all times frames.
Chart 3 shows the favourable position of the real estate sector on a return to volatility basis over the last 36 months.
For further information on Brainpower’s professional portfolio analysis software, please visit www.brainpowerweb.com or contact Alan Parmenter on
+44 (0) 20 7392 7108
Data, charts and comment supplied by Brainpower


